Marketing > Agent Dashboard > Agent Performance Tile
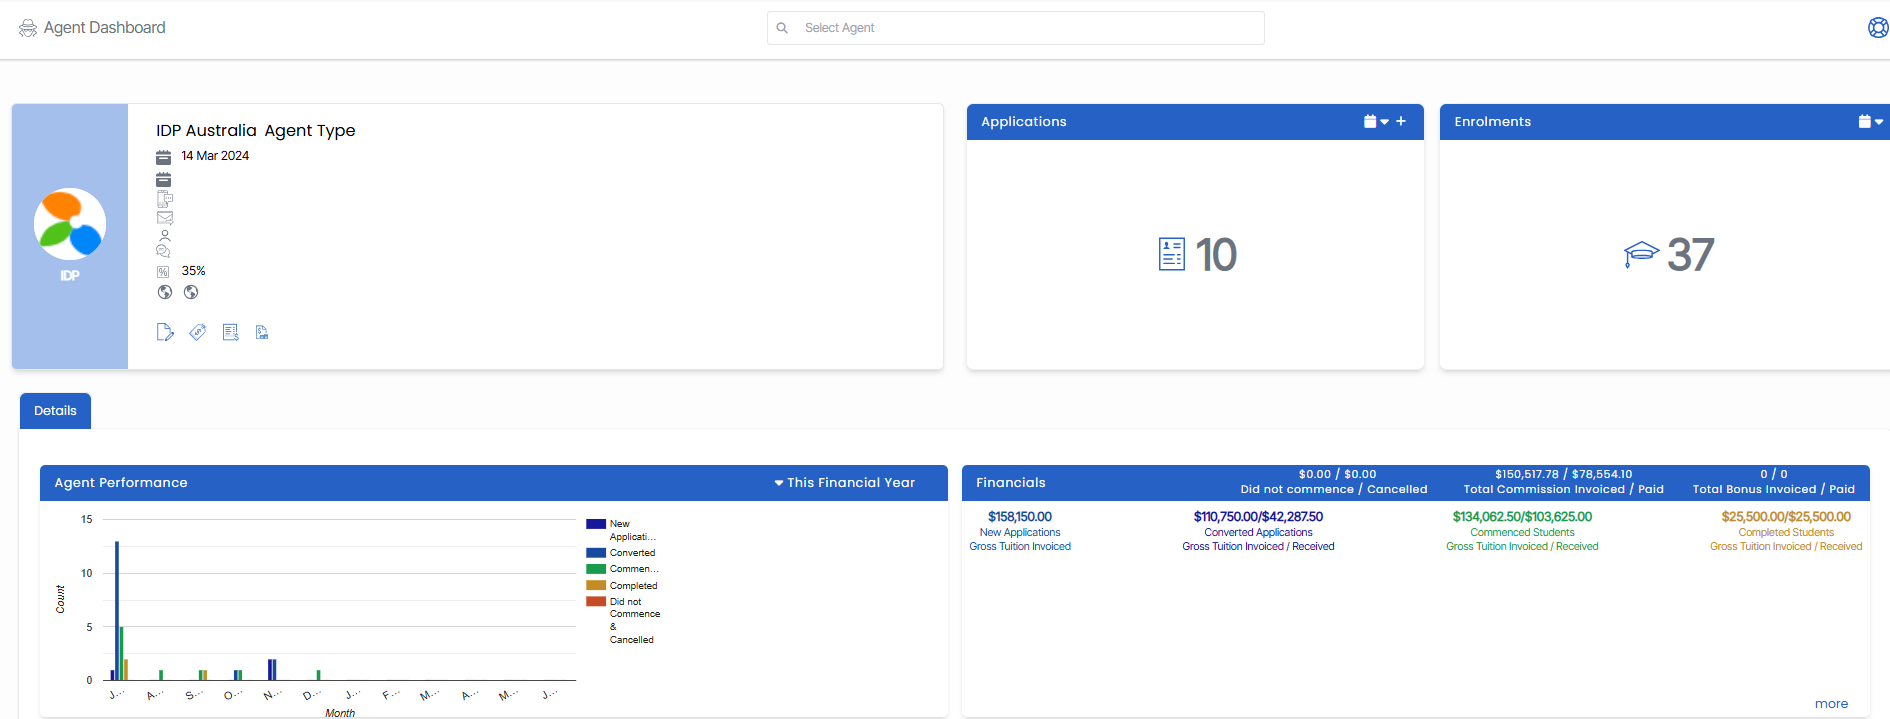
Each CRICOS RTO that has collaboration with agents, needs to monitor the agent performance in order to make up their mind in taking certain decisions. On the Agent Dashboard, we have a bar graph that can give you a vast amount of information to keep a check on the agent performance.
This bar graph will display the agent performance for the current financial year. On the right top side of the bar graph, you can see the calendar option. From there, you can change the date range as per your requirement.
Click here to learn about the calendar option
Bar Graph
The horizontal line of the bar graph will display the months based on what calendar option you select. The vertical line of the bar graph will display the count and that count again varies depending upon the calendar option. The vertical colourful bars in the bar graph will present the data with a tooltip. Once you will move your cursor over the bar, you can see a tooltip based on which colour bar you have moved your cursor to. Each colour represents a different purpose. You can see the colour classification on the right side of the bar graph.
As you can below, the tooltip says Converted Applications 7 for the month of Mar 2024. It means for March month, there are just 2 applications to process for that agent, hence the height of the bar is till count 7. So from these colourful bars, you can easily read how many total applications linked with the agent, how many converted, commenced, completed, and did not commence & canceled.
Financials
Just beside the bar graph, we have the financials area for that agent. This is easily readable from the labels just below the figures. This gives you the Tuition Fee’s data based on the calendar option you select.
Moreover, there is a more button in this section that will directs you toward the Agent Financial Transaction screen.